Paris in 3D with QGIS and three.js
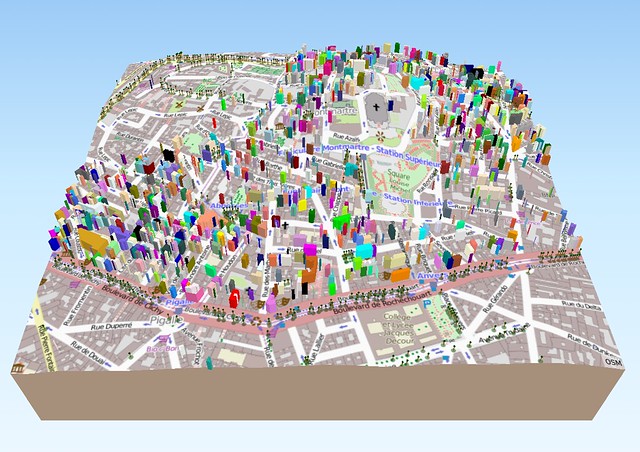
Some time ago, I saw this article about using the Qgis2threejs plugin to export a QGIS map as a 3D visualisation in the browser, thanks to three.js and WebGL. When I recently tried to follow the post to reproduce the results, I had some problem sourcing the data (related to Vienna, Austria) so instead I searched for data related to Paris to create a similar scene. Here is the result corresponding to the screenshot above and another one with aerial photos, both showing the Montmartre area of Paris.
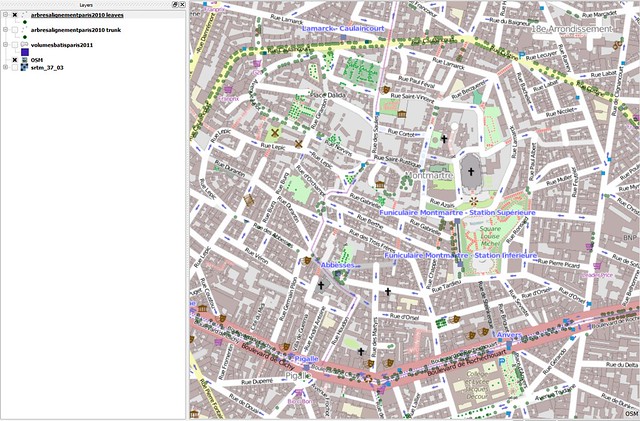
The first step was to create a standard QGIS map with all the necessary data:
- Base map: OSM Mapnik tiles. To display them in QGIS, there are multiple ways: Either use the OpenLayers plugin, by selecting the OpenStreetMap layer, or the TileLayer plugin, by first copying this tile description file into the ~/.qgis2/python/plugins/TileLayerPlugin/layers/ directory and then selecting the OSM layer with the plugin.
- Elevation data (DEM): I downloaded the tile that covers most of France from the SRTM Tile Grabber. It provides a Tiff that will be displayed by QGIS in levels of gray by default.
- Tree data: a SHP layer with the locations of trees lining the streets of Paris (Arbres d’Alignement), obtained from the French OpenData portal (data.gouv.fr). I actually added the same layer twice in the QGIS project, so that in Qgis2threejs, I could export one of the layers as the trunks of the trees (cylinders) and one as the leaves (spheres). I kept one of the layers visible, rendered as a circle with some transparency so it would look like a shadow of the tree, and hid the other.
- Building data: a SHP layer with the location of buildings in Paris (Volumes bâtis), obtained from the Paris OpenData portal. It only contains the first 50000 buildings of the full dataset. The full data is pretty big, so this will do for my needs. If necessary, the GeoJSON dataset contains all the buildings.
The Qgis2threejs plugin will use what is currently in the QGIS map window as the texture for the 3D terrain. Therefore only the layers that should be in the output should be kept visible: This is why some of the layers are unchecked in the QGIS UI shown in the screenshot above.
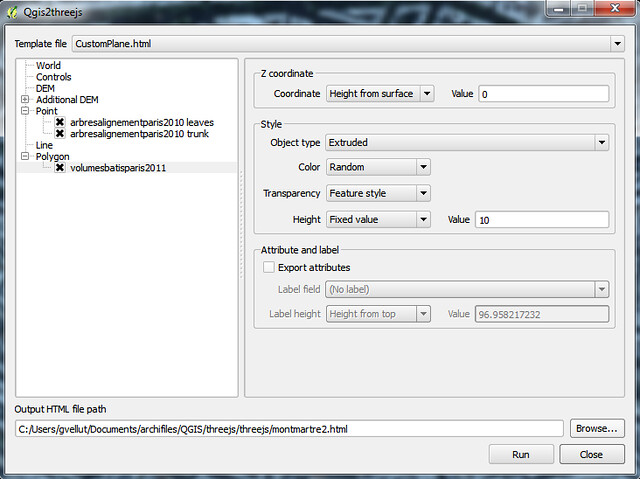
All the layers, even if not visible in the QGIS map, can be configured to be output in vector form, potentially with some transformation applied, like an extrusion or a sphere. These are the settings that I used:
- DEM: The SRTM elevation data.
- Tree leaves: Green sphere of radius 3m at 5m above the ground.
- Tree trunks: Beige cylinder of radius 0.5m and height 5m at 0m above the ground.
- Buildings: Extrusion of 10m, with random colors.
I also applied some vertical exaggeration in the World settings.
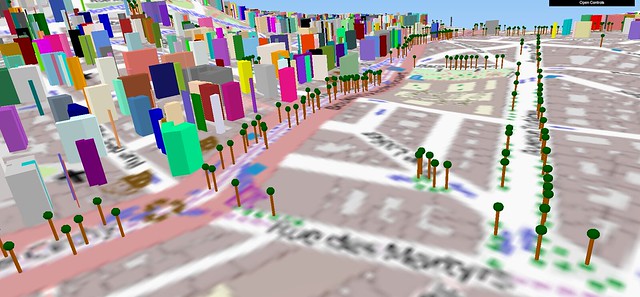
After launching the conversion (which does not take very long for such a small extent), the browser opens a web page with the exported visualisation.
Above, an alternative version, with aerial photos.


